Data Science: Space Race Analysis & Visualization
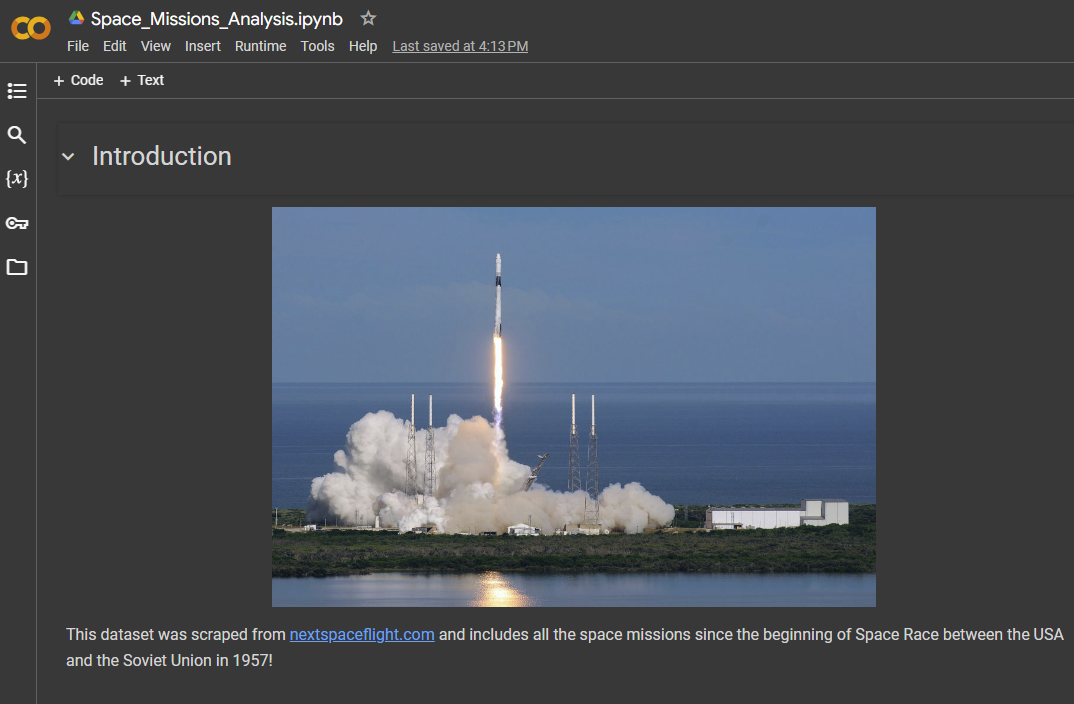
For day 99 of the 100 Days of course, the end goal was to analyze and visualize the space race. This and day 100 of the course lean on the concepts covered during days 72 through day 81 of the course.
Project Goals & Steps to Complete
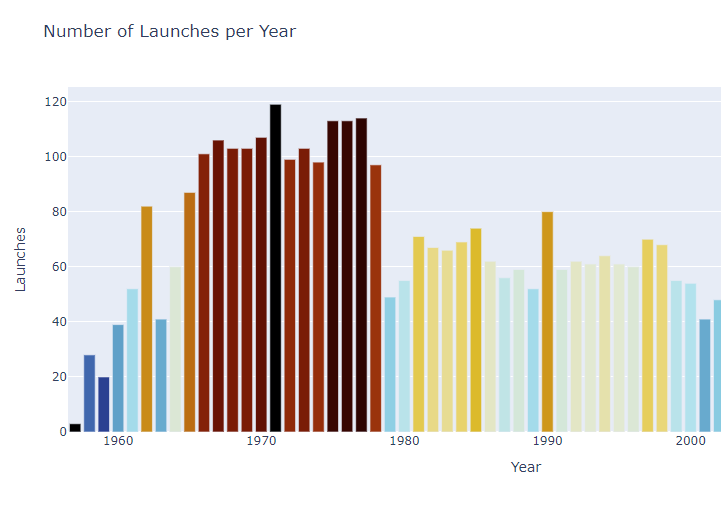
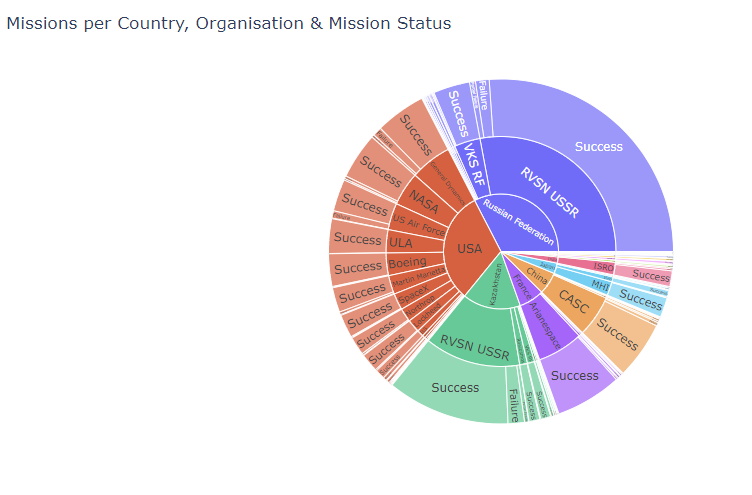
The goal for this project was to analyze data from the space race. The data attached to the course went up through the year 2020.
This project was different from the previous portfolio projects since this project was completed using an ipynb file. Additionally, the tasks in the project felt more linier and like completing mini challenges progressing through the end of the notebook.
Project Challenges
This project was very challenging compared to the previous portfolio projects.
The biggest challenge in completing this project was that the data analysis and data visualization portions of the course were very different compared to previous portions of the course. I had initially completed the data science portion (Days 72-81) of the course in mid-November of the previous year. I did not make it to this portion of the portfolio projects until about mid-May. Prior to starting work on this project, I went back to days 72-81 of the course to refresh my memory on how the projects were completed. With this refresher, I felt confident in completing the tasks required for this project.
There were plenty of challenges that took some thinking and research in overcoming this long gap, but ultimately, I was able to make my way through the end of the notebook’s tasks.
Project Takeaways
Although the completion of this project was a challenge, it did feel good making it through the end of the notebook. I am sure there were more efficient ways of manipulating the data for the project, but I was able to shape the data to produce what was being asked.
The challenge of completing this project was fun and I am looking forward to tackling day 100 of the course!